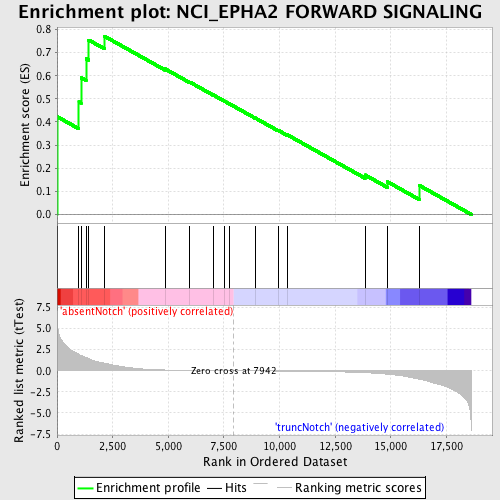
Profile of the Running ES Score & Positions of GeneSet Members on the Rank Ordered List
| Dataset | Set_03_absentNotch_versus_truncNotch.phenotype_absentNotch_versus_truncNotch.cls #absentNotch_versus_truncNotch.phenotype_absentNotch_versus_truncNotch.cls #absentNotch_versus_truncNotch_repos |
| Phenotype | phenotype_absentNotch_versus_truncNotch.cls#absentNotch_versus_truncNotch_repos |
| Upregulated in class | absentNotch |
| GeneSet | NCI_EPHA2 FORWARD SIGNALING |
| Enrichment Score (ES) | 0.77136844 |
| Normalized Enrichment Score (NES) | 1.5882213 |
| Nominal p-value | 0.013363029 |
| FDR q-value | 0.29716924 |
| FWER p-Value | 0.935 |
| PROBE | DESCRIPTION (from dataset) | GENE SYMBOL | GENE_TITLE | RANK IN GENE LIST | RANK METRIC SCORE | RUNNING ES | CORE ENRICHMENT | |
|---|---|---|---|---|---|---|---|---|
| 1 | PTK2 | 1780148 | 1 | 6.937 | 0.4231 | Yes | ||
| 2 | GRB2 | 6650398 | 982 | 1.909 | 0.4869 | Yes | ||
| 3 | CBL | 6380068 | 1079 | 1.799 | 0.5914 | Yes | ||
| 4 | RAC1 | 4810687 | 1304 | 1.548 | 0.6738 | Yes | ||
| 5 | TIAM1 | 5420288 | 1420 | 1.424 | 0.7545 | Yes | ||
| 6 | INPPL1 | 110717 3120164 | 2119 | 0.893 | 0.7714 | Yes | ||
| 7 | PAK1 | 4540315 | 4854 | 0.085 | 0.6296 | No | ||
| 8 | PIK3CA | 6220129 | 5960 | 0.041 | 0.5727 | No | ||
| 9 | VAV3 | 1050731 2450242 2680653 | 7008 | 0.016 | 0.5174 | No | ||
| 10 | EFNA1 | 3840672 | 7533 | 0.007 | 0.4896 | No | ||
| 11 | SRC | 580132 | 7737 | 0.003 | 0.4789 | No | ||
| 12 | VAV2 | 3610725 5890717 | 8898 | -0.016 | 0.4175 | No | ||
| 13 | PIK3R1 | 4730671 | 9937 | -0.035 | 0.3639 | No | ||
| 14 | ACP1 | 1990435 | 10344 | -0.044 | 0.3447 | No | ||
| 15 | BCAR1 | 1340215 | 13843 | -0.233 | 0.1708 | No | ||
| 16 | EPHA2 | 5890056 | 14854 | -0.403 | 0.1411 | No | ||
| 17 | RHOA | 580142 5900131 5340450 | 16279 | -1.002 | 0.1256 | No |

